


As the Pirates’ tremendously bad 2010 season wrapped up, my dad said to me several times, “I don’t know how a team this bad can ever be good.” I’d point out how bad the 2003 Tigers or the 2004 Diamondbacks or the Rays’ entire existence prior to 2008 were and how quickly those franchises turned things around. Of course, it’s all well and good to say that, but since then I’ve been wondering a few things. How quickly do most teams that lose an extraordinary amount of games get their franchise back on the right course? Is it something that’s more common in 2011 than it was in, say, 1954?
My general working theory for this little research project is that teams aren’t as likely to be really bad (defined as 105+ losses) now as they were prior to expansion and free agency and that the teams that are awful now are often awful because being mediocre just hasn’t made a ton of sense since about 2003 because it often requires a large amount of money without seeing a significant reward and it costs teams a potentially elite draft pick. For example, the Rays picked first in the 2008 draft, then went to the World Series in 2008 and on the way there used David Price, the first overall pick of the 2007 draft. Being awful pays off these days if you know how to use it to your advantage and that just wasn’t all that true in the 40s or 50s.
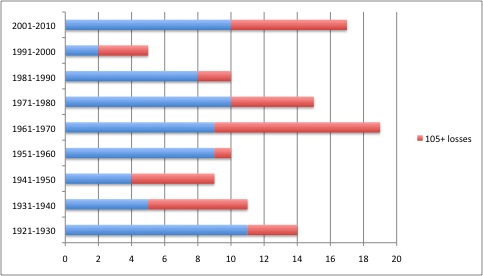
After messing around with Baseball Reference‘s Play Index for a bit, I found a way to use the game log to track and sort total team losses. The game log goes back to 1920, but in the interest of keeping round decades I decided to start this little study with 1921 and cut the last 90 years up into 10-year slices (1921-1930 etc. through 2001-2010). Since 1921, there have been 110 100-loss teams, and 42 of them have lost 105 games or more. Here’s a graphical breakdown of 100 loss teams in each decade since then, with the red portion of the bar representing the truly bad teams with at least 105 losses:

There were some bad teams in the 30s and 40s, but the number of bad baseball teams really exploded in the 1960s. This is mostly because of expansion. The Mets lost 105+ games in each of their first four seasons and the Padres and Expos both crossed the barrier in their first year of existence. That trend generally continued during the 70s as the new franchises continued to struggle and the league expanded, but it was curbed a bit after the introduction of free agency in 1975 (for reference, 23 of the 100-loss seasons and 10 of the 105+ loss seasons occurred between 1962 and 1975; that’s about 25% of each in about 17% of the sample). This past decade, though, has seen an explosion of bad baseball teams. That would seem to make some sense sense; the gap between the haves and have nots seems subjectively much larger now than it was 12 or 15 years ago.
Just counting the number of 100 and 105+ loss teams is a bit misleading, though, since there are 30 teams now and there were only 16 teams between 1921 and 1962. Instead of a raw number, this chart expresses 100 and 105+ loss teams as a percentage of the total number of team seasons in each decade (ie, there were 160 team seasons played by the 16 MLB teams between 1921 and 1930, there were 300 played between 2001 and 2010):
| decade | Total 100+ | 105+ losses | total % | 105+ % |
| 1921-1930 | 14 | 3 | 8.75 | 1.88 |
| 1931-1940 | 11 | 6 | 6.88 | 3.75 |
| 1941-1950 | 9 | 5 | 5.63 | 3.13 |
| 1951-1960 | 10 | 1 | 6.25 | 0.63 |
| 1961-1970 | 19 | 10 | 9.22 | 4.85 |
| 1971-1980 | 15 | 5 | 6.05 | 2.02 |
| 1981-1990 | 10 | 2 | 3.85 | 0.77 |
| 1991-2000 | 5 | 3 | 1.77 | 1.06 |
| 2001-2010 | 17 | 7 | 5.67 | 2.33 |
So we have a higher percentage of 105+-loss teams than we’ve had since expansion, approaching the rates in the rather unbalanced 1930s and 1940s. That brings us back to the initial question: Do awful teams now turn things around quicker than they did in the past?
Prior to expansion (1921-1961) there were 16 teams that lost at least 105 games. Of those 16, just two turned around to a winning record within the next three years; the 1939 St. Louis Browns dropped 111 games and had a winning record in 1942 and the 1946 Philadelphia A’s turned their 105-loss season into a winning record in 1947.
Since expansion made the league extremely volatile until free agency was introduced I’m not sure the teams between 1962 and 1974 are applicable to present-day baseball, but since 1975 there have also been 16 teams that have lost at least 105 games. Of those 16 teams, six have rebounded to a winning season within three years and a seventh pulled a .500 season (it’s also worth noting that two of those 16 seasons were recorded in the Blue Jays’ first three years of existence). The 1979 Oakland A’s turned 108 losses into a winning record in 1980, the 1988 Orioles turned 107 losses into 87 wins in 1989, the 1988 Braves lost 106 games and were in the 1991 World Series, the 1991 Indians lost 105 games and were in line for a wild card when the strike hit in 1994. We’ve also got the aforementioned examples of the 2003 Tigers and 2004 Diamondbacks and the 2002 Brewers that finished 2005 with a .500 record.
That’s seven of the last 16 and three of the last seven 105 loss teams that have turned things around in reasonable time. It’s hard to really draw a conclusion without a much more detailed roster analysis (those Tigers went on quite a spending spree, for example), but, longer season aside it looks like pretty solid evidence to me that teams are turning things around much quicker in last 30 or so years than they did in the 30s or 40s or 50s. Teams like the Phillies, A’s, Browns, and Red Sox turned up again and again in my searches of the pre-expansion era and they were more or less the only teams to show up, but in the 2000s even a team like the Tigers, that had been abjectly awful for a long time, can turn things around relatively quickly with some good drafting and shrewd signings.
Of course of those seven teams only about half (the Braves, Indians, Diamondbacks, and Tigers) went from doormats into real, breathing playoff teams in short fashion and the only team here to lose 105 games in their EIGHTEENTH CONSECUTIVE LOSING SEASON is of course the 2010 Pirates, which sort of puts a premium on turnaround time. I could just as easily ask the opposite question (how many 105+ loss teams lose 100 games again in the next three years, (the Tigers, for example, did it in 1996 AND 2002 AND 2003 before turning the ship around), but I’m trying to optimistic here. Recent history seems to suggest that 105 losses in a season doesn’t have to be a death sentence for the immediate future.