


From the perspective of a Pirate fan/self-styled Pirate analyst, Charlie Morton is both one of the most intriguing and important Pirates heading into 2011. He’s both talented and frustrating and if the Pirates’ pitching staff is going to improve on its horrendous 2010 campaign, he and the Pirates’ coaching staff are going to have to figure out what went wrong in 2010. His proverbial “electric stuff” provides a higher ceiling than Scott Olsen (currently the other option for the Pirates’ last rotation spot) and maybe every other Pirate pitcher not named James McDonald.
Most people would break Morton’s 2010 down into two portions, the early part of the year when he struggled and fell apart whenever someone got on base and the end of the year when he came back after his demotion and pitched a bit stronger. It might be a bit more instructive to break things down a bit more, though. I saw four Mortons last year; early in the year he was putting up great strikeout and walk numbers but getting badly dinged by home runs, then his strikeout numbers dropped a bit while he still struggled, then he was demoted. After his demotion, he gave up fewer runs in his first few starts back even though his peripherals didn’t seem to match, and finally he finished the year with three strong starts. So let’s start by looking at his important splits from each stretch with his PitchFX profile (all PitchFX data pulled from Brooks Baseball’s expanded tables, then put together by me in Excel, other stats are from Baseball-Reference).
Starts 1-5: 19 1/3 IP, 20 K, 8 BB, 7 HR, 34 H, 31 R, 27 ER, .415 BABIP, 0,72 GB/FB, 60% strikes (18% strike looking, 9% strike looking)
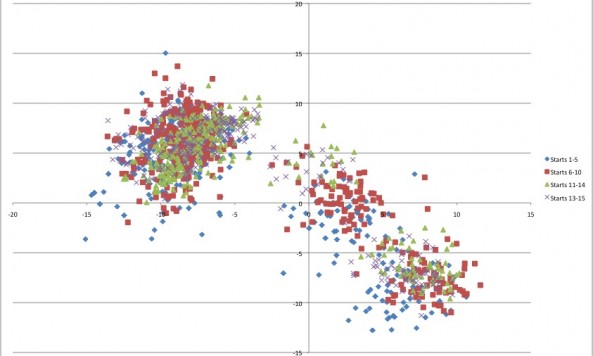
If you’re unfamiliar with PitchFX, I can’t recommend this Sons of Sam Horn primer on it enough. Quickly, though, what we’ve got here is a chart of Morton’s vertical break vs. his horizontal break. The giant blue blob on the left are his fastballs and changeups (two seamers break in on righties more, changeups have more drop), the less dense spots on the right are sliders (upper left portion of that grouping) and curveballs (lower right portion of that grouping). Imagine your perspective as that of the catcher. The origin of the graph (0,0) is where a pitch would cross the strike zone with absolutely no spin on it, while the horizonal axis represents the direction the ball breaks (positive numbers relative to the origin are breaking away from a right-handed pitcher, negative numbers are tailing in). Fastballs don’t rise; they simply drop less.
Starts 6-10: 24 IP, 15 K, 8 BB, 5 HR, 32 H, 21 R, 18 ER, .321 BABIP, 1.05 GB/FB, 64% strikes (15% strike looking, 8% strike swinging)
So on the whole, we see his strikeouts come down a bit, but his homers do as well (likely due to drop in BABIP). There seems to be a bit more differentiation between his slider and his curve here, but his fastball appears almost identical in terms of break. With his groundball rate coming up a bit, I thought we might see that he’d thrown more two-seamers than in the early part of the year, but that doesn’t seem to be the case here.
Starts 11-14: 18 1/3 IP, 6 K, 8 BB, 2 HR, 28 H, 19 R, 14 ER, .371 BABIP, 1.00 GB/FB, 65% strikes (17% strike looking, 6% strike swinging)
Immediately after Morton’s return, he barely struck anyone out, but he kept the ball in the park and kept getting groundballs, which meant that he gave up fewer runs than he had prior to his demotion. The fastball/changeup profile seems to level out a bit, which I guess could indicate that his two-seamer and four-seamer have differentiated a bit.
Starts 15-17: 18 IP, 18 K, 2 BB, 1 HR, 18 H, 18 R, 18 ER, .340 BABIP, 1.00 GB/FB, 64% strikes (18% strike looking, 10% strike swinging) And suddenly, Charlie is Electric Charlie Morton. He ended the season by getting strikeouts, not walking hitters, keeping the ball in the park, keeping the ball on the ground, getting swings and misses, and succeeding despite opposing hitters hitting .340 against him on balls in play, which is still very high. The slider and the curveball are two very different pitches here and he’s leaning on the curveball a bit more and the slider a bit less than he did early in the season, which matches his 2009 pitch selection closer than his early 2010 selection.
So let’s look at the season’s work as a whole:

The purple is a bit hard to see,, but the big differences I see for Morton are that his slider seemed to level out a bit relative to his curveball (this sounds like a bad thing, but it’s still a very different pitch from his fastball and it’s possible that he was controling it better late in the season with less break on it) and that his two-seamer and four-seamer differentiated a bit, which could help explain the big drop in home runs after he came back from the minors. There’s also a question of velocity, but what I’m most curious about is the change in his fastball/slider and where his home runs went, so that’s where part two will pick up.