Before we get started on the hard numbers and little graphs, I think a good place to start is with this comment by Hamburger on the last post about Ohlendorf:
Hamburger said:
I know it’s not the most telling stat since it only factors in HR, BB, and K, but one thing that I find interesting is that during that second half with the 2.75 ERA, Ohlendorf’s FIP was actually higher than it was the rest of the year when his ERA was up in the 4.70s. How much of that was just luck?
This seems as good a time as any for a brief primer on advanced pitching metrics, for anyone that’s interested. If this isn’t new to you or you aren’t interested, just click after the jump for the stuff about Ohlendorf. FIP was invented by Tangotiger is calculated by The Hardball Times as an attempt to estimate ERA using only factors a pitcher can control; strikeouts, walks, and home runs. The formula they use is [(HR*13+(BB+HBP-IBB)*3-K*2)/IP]+x where “x” is a league-specific constant used to adjust the number to make it an ERA equivalent. Using that formula and back-engineering the league-specific number as 3.1 from full-season numbers, Ohlendorf’s FIP in his first 20 starts is 4.71 and his FIP in his last nine was 4.74 (one of those numbers needs tweaked very slightly because he issued one IBB this yearand I’m not positive when it was).
So if his strikeout rate and walk rate improved appreciably in those last nine starts, why does his FIP go up? The answer is in the home runs, which increased fairly considerably in those last nine starts. The thing is, FIP isn’t necessarily the best pitching metric for this exact reason. There’s some data that shows that home runs are actually more a product of flyball rate and park factor and they’re not directly influenced by the pitcher. THT has also come up with a stat to adjust for this, which they call xFIP. Because I don’t know the adjustment they use, I can’t estimate the xFIP for Ohlendorf’s first 20 and last nine starts. I’m guessing, thought, that it would bear out his improvement where FIP doesn’t would because his flyball rate really didn’t change much (it actually improved a bit). We’re also working with a very small sample size here; of the ten homers allowed by Ohlendorf, four came at hitters’ parks like Minute Maid Park and Coors Field. If we remove just one of those homers, his FIP over those last nine starts drops to 4.52. If we get rid of two of them, it drops to 4.30.
So that’s the story on Ohlendorf using some adavanced pitching metrics. After the jump, charts and graphs! I bet you weren’t planning on learning this much about anything today.
Typical PitchFX post header: all data comes from the invaluable Brooks Baseball. I’ve taken the numbers accumulated there, plugged them into Excel, and these graphs are my own. If you’re uncertain how to read any of these graphs, I’d recommend reading this post of mine or this primer at Sons of Sam Horn.
The most important question here, at least for me, is how adding speed has affected the break on Ohlendorf’s fastball. Here’s the chart of his fastball break with his first twenty starts in black and his last nine in gold (not yellow, dammit! gold!).

It’s hard to tell from that graph, but there does seem to be a shift in the center of the clusters. I ran the numbers to get averages with a 95% confidence interval and in his first twenty starts, his fastballs have -7.72 +/- 0.12 inches of horizontal break (that is, in on right-handers) and 6.85 +/- 0.12 inches of vertical break. In the last nine, those numbers are -6.58 +/- 0.15 and 8.38 +/- 0.18. In layman’s terms, the difference is statistically significant, and his fastballs are less like sinkers. This is borne out by the algorithim that classifies the pitch type, which called maybe 20% of his fastballs two-seamers in his first 20 starts, but only 2 of 545 two-seamers in his last nine.
This didn’t affect his control all that much . In his first 20 starts, he threw his fastball for a strike 65.9% of the time, in his last nine it hit the strike zone (gulp) 66.6% of the time. He did use the fastball more, though. In those first twenty starts, he threw his fastball 58.6% of the time while in the last nine he went to it on 62.1% of his pitches.
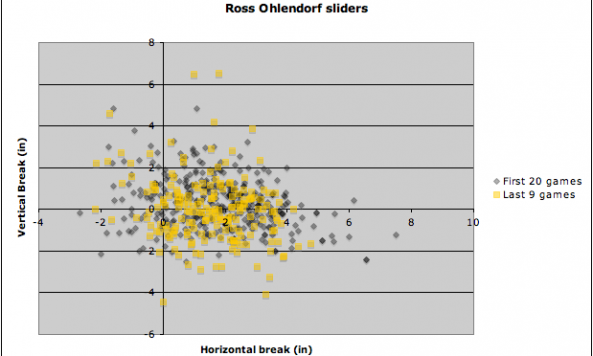
Moving on to his breaking pitches, his slider looks about the same and the speed hasn’t changed a whole lot (from 80.3 mph to 81.1 mph). He’s also throwing the slider a little more, too going from 19.1% to 21.8%

Finally, we can look at the changeup (he throws a curveball, too, but not that often). The speed is about the same (82.4 mph to 82.5), which is nice to compliment his faster fastball. He’s not throwing it nearly as much(16.5% of the time in his first 20 starts, just 10.6% of the time after), but it looks so similar on the charts to the naked eye that I’m not going to run the numbers.

So can we draw conclusions? It’s clear that by ramping his fastball up to the velocity he had it at by the end of the season makes him a little bit more of a power pitcher and less of a sinkerballer. He loses some of the “down and in” action that a sinker typically shows against right-handed hitters. Adding velocity to his fastball doesn’t affect his control nor does it change his two other main pitches, his slider and his changeup.
When I first looked at this back in June, it seemed to me that Ohlendorf’s fastball really didn’t have enough sinking action for him to use it like a “power sinker” the way a guy like Brandon Webb does. That’s how the Pirates were describing him, though, and the results in the early parts of the season were mixed. Once he got his fastball back, though, he became more of a traditional fastball/slider pitcher with what seem to me to be improved results. He’s still not what I’d describe as a “power” pitcher, though. His fastball is creeping up into that zone, but even in his good stretches his strikeout rate didn’t move above 7 K/9. The problem there is probably the slider; a good hard slider for a power pitcher is usually in the mid 80s that looks like a fastball at a similar velocity, then dives away from right-handed hitters. If Ohlendorf’s slider is in the low 80s, it’s certainly not fooling as many batters.
What I’d really like to see is for Ohlendorf to start mixing his two-seamer and his four-seamer, since he seems to have regained that velocity on his four-seamer. He got good results at the end of the year with that rediscovered velocity, but his very low ERA in those last nine starts doesn’t quite meet up with the peripherals. I do think he was clearly better over those final nine starts, but I also think that he can be better if he finds a pitch to use with his fastball to keep hitters off balance.

